Biologic Denial Financial Exposure Modeling
Infusion practices vastly underestimate denial costs by tracking only lost reimbursement.

Biologic denial exposure is almost always undercounted, because most infusion practices only add up the reimbursement they didn't get. That's the smallest piece of the real number. The full exposure includes drug capital tied up in unpaid inventory, staff hours burned on appeals, and a write-off layer that denial reports miss because those claims were never appealed to begin with. Adding all four together, the true number runs several times higher than what's printed on a denial letter. Practices that only track the reimbursement line are, in effect, managing the smallest cost they face.
Drug capital at risk: what a denied biologic costs before appeals even begin
In a buy-and-bill model, the practice buys the drug, gives it to the patient, then asks the payer to pay for it. That order matters. A denial doesn't undo the purchase. The vial is gone, the infusion chair time is spent, and the practice is now holding an uncollected receivable instead of cash.
For rheumatology practices, biologics can make up 60 to 70% of total revenue, and denial rates on specialty medications commonly run 25 to 35%. Running that math shows a large chunk of a practice's drug spend is in denial status at any given moment, going nowhere. A denied rituximab infusion alone can cost $6,000 to $8,000. Scale that: a practice running 200 infusions a month at a 30% denial rate is carrying annual exposure somewhere between $4.32 million and $5.76 million, in drug that's already been bought and administered. That's inventory money, frozen, not a billing abstraction sitting in a spreadsheet. That's inventory money, frozen.
And it stays frozen for a while. A manual appeals cycle typically runs 45 to 90 days. The practice ends up financing the payer's delay out of its own inventory budget, often while placing the next order for the same drug. A wave of biologic denials behaves less like a paperwork backlog and more like a cash-flow emergency. Practices that don't track acquisition cost separately from the reimbursement figure on each denied claim can't even see this layer, let alone decide which denials to chase first.
The staff cost of appeals: converting labor hours into an exposure figure
Appeals cost money even when they win. Every biologic denial that gets worked eats staff time: pulling clinical documentation, scheduling a peer-to-peer, writing the appeal, then following up for another 45 to 90 days before anything resolves. That labor has a salary attached to it, and almost nobody traces that cost back to the denial that caused it.
Resource limits cap how much of this labor ever gets spent. Industry benchmarking (HFMA and Premier data, alongside MGMA figures) puts the share of denials actually appealed at around 35%. Staff capacity is the ceiling here, not willingness.
Payer rules make the per-case labor cost worse. BCBS medical necessity denials routed through AIM Specialty Health involve a multi-step review process that can pull physician time into the process alongside billing staff. AIM's clinical criteria have continued to evolve, with shifting requirements around prior treatment history that practices must track closely. When criteria shift, practices can find previously approvable clinical approaches newly denied, generating fresh appeals work with no change on the medical side.
Deadlines compound the labor cost, because a missed deadline turns a recoverable claim into a permanent write-off. UHC's peer-to-peer window is narrow from the denial date. BCBS varies by state, anywhere from 60 to 365 days, with most standard commercial plans landing around 180. A denial management analysis from MBC, covering 240 specialty practices, found that treating UHC and BCBS denials the same way, running one generic appeals process across both, leaves 30 to 45% of recoverable revenue on the table. The labor gets spent either way. It just produces a worse outcome when the process isn't built around the payer.
A real exposure model needs a dollar figure for appeals labor, even a rough cost-per-denial-worked number, because that cost piles up whether the appeal succeeds or not.
The write-off layer: exposure that never appears in denial reports because it was never appealed
Denial rate percentages only capture what got denied. They say nothing about what got written off quietly, with no appeal ever filed.
Since practices only work a fraction of denials, a meaningful share of denied biologic claims goes straight from "denied" to "written off" and never registers as a lost appeal. It just disappears from AR. Nobody logs it as an exposure event because, technically, nothing was ever fought for and lost. Finding this layer means auditing closed AR for claims that aged past the appeal window with no appeal attempt on file, rather than looking only at claims that were appealed and denied again.
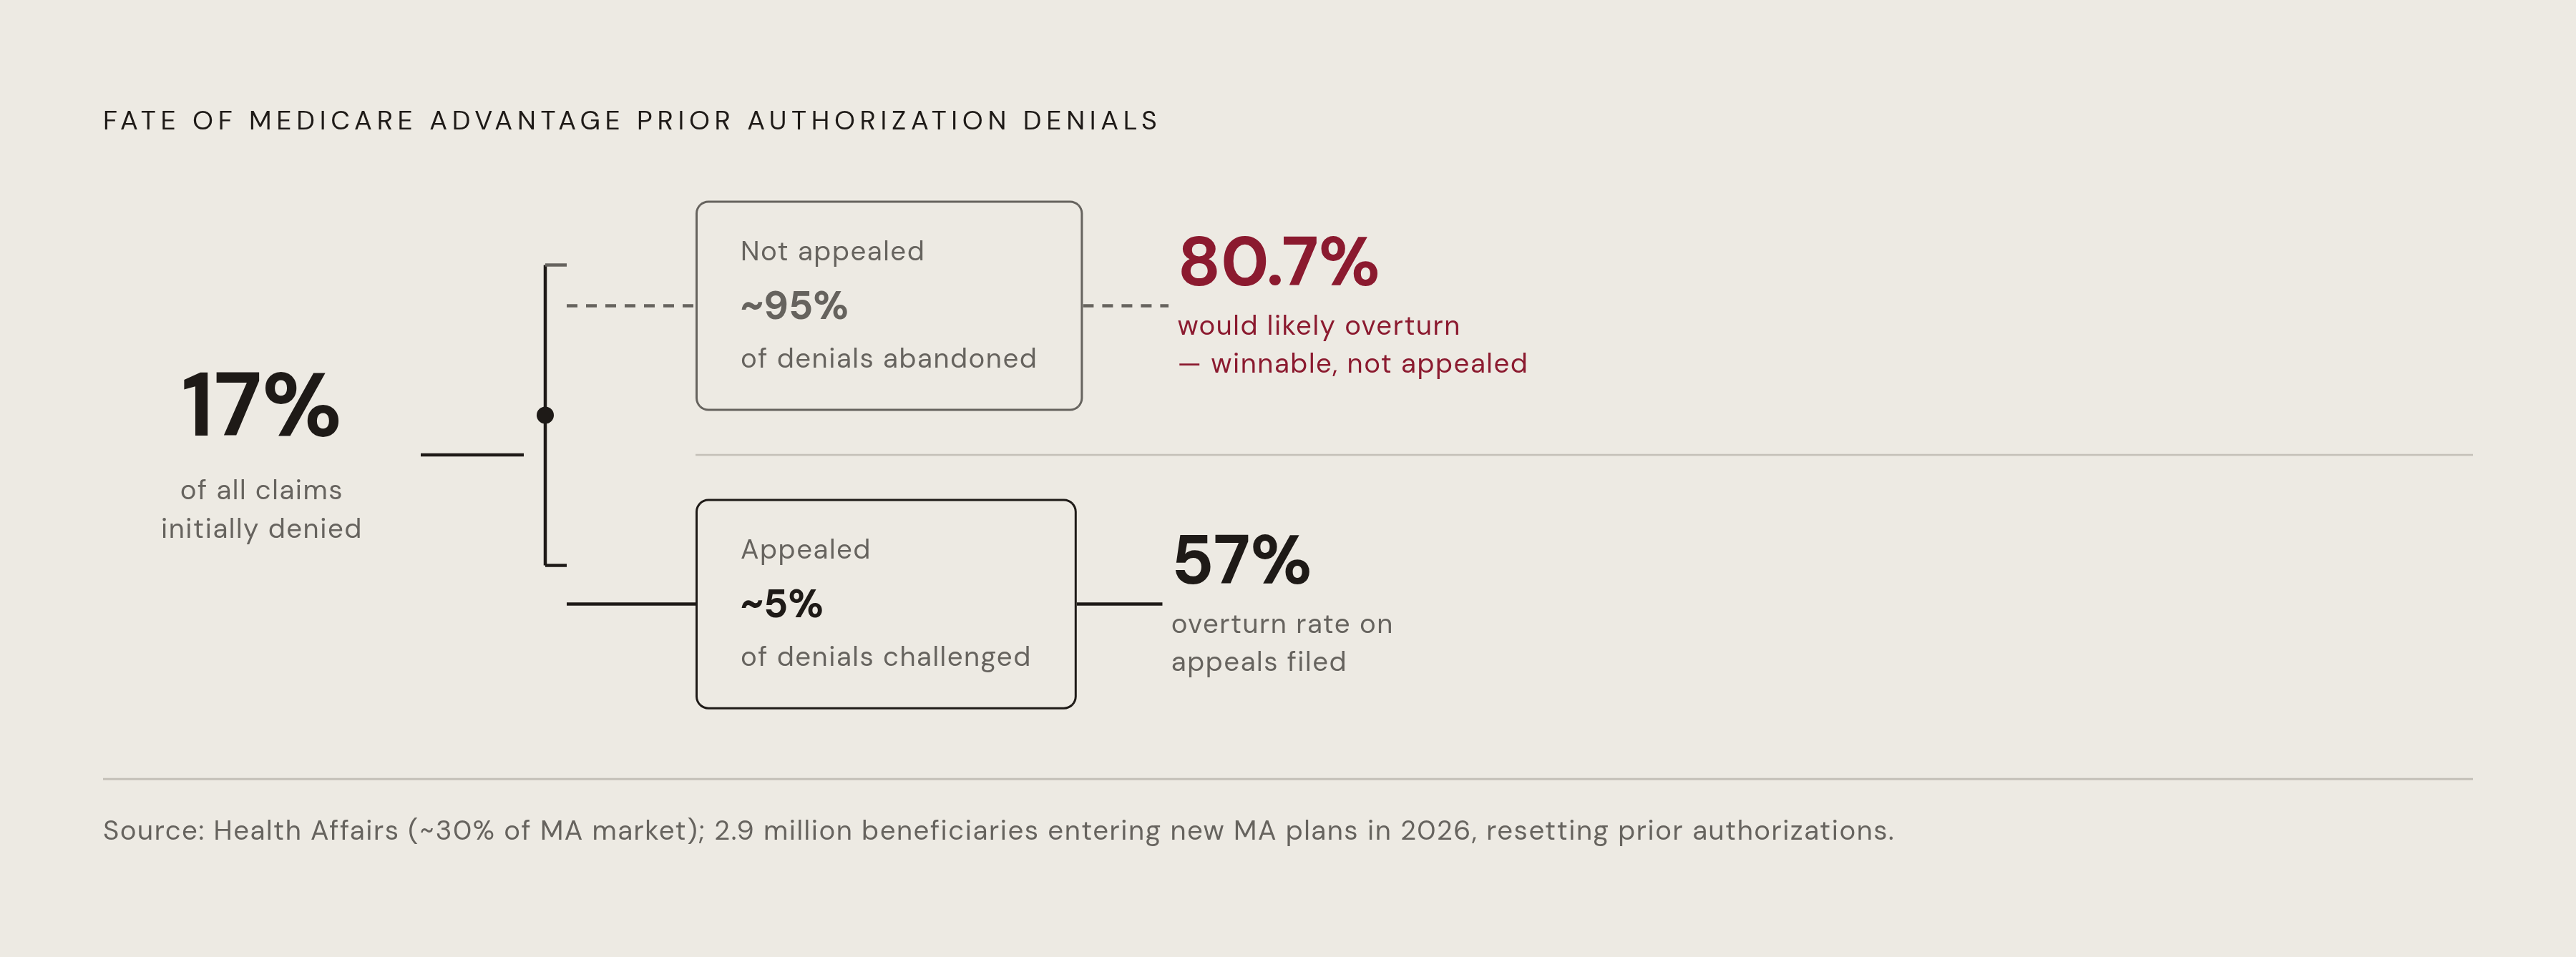
Medicare Advantage plans make this layer expensive. A Health Affairs study covering roughly 30% of the MA market found an initial denial rate of 17%, and of those denials, 57% got overturned on appeal once someone actually worked them. Separately, the overturn rate on MA prior authorization appeals runs as high as 80.7%. Read together, those two numbers point to a hard conclusion: most abandoned denials aren't legitimate coverage exclusions. They're winnable claims nobody fought for.
The problem is about to get bigger. Roughly 2.9 million Medicare beneficiaries are being pushed into new MA plans for 2026 because their old plans are exiting the market, and every one of those transitions invalidates existing prior authorizations. A fresh wave of denials is coming, and plenty of practices will mistake those denials for final answers instead of the appealable claims they actually are.
The write-off layer also feeds back into the labor layer. Appeals capacity is finite, so every hour spent chasing a low-value, unwinnable denial is an hour not spent on an $8,000 biologic claim with an 80% overturn probability. That's a real opportunity cost, and it compounds month over month.
Building a complete exposure model: how the four dimensions compound
A complete exposure model tracks four inputs for each denied biologic claim. Lost reimbursement is the contracted rate for drug plus administration that never gets paid. Drug capital cost is the practice's own acquisition cost for the biologic, already spent by the time the denial lands. Appeals labor cost is staff and physician time spent working the claim, regardless of outcome. Write-off exposure is the value of denials that age out with no appeal ever filed, tracked as a portfolio number rather than claim by claim.
Take a rheumatology practice seeing 30 to 50 denials a month at $2,000 to $8,000 per episode. The reimbursement layer alone puts $720,000 to $4.8 million a year at risk, before drug capital, labor, or write-offs get added on top of that.
These layers don't run one after another. They run at the same time, on every unresolved denial. Drug capital sits frozen for the length of the appeals cycle. Labor gets consumed during that same window. Write-offs crystallize at the end of it, if nobody filed in time. At scale, this is visible in hospital finances too: hospitals spent close to $18 billion overturning denials in 2025, and the AHA estimates total spending near $43 billion trying to collect money insurers already owe. That's the labor layer, blown up large enough to see clearly. Infusion practices carry a smaller, proportional version of the same cost, and it's still real money.
None of this needs perfect precision to be useful. Even a rough pass at the labor and write-off layers usually shows total exposure running several times higher than the reimbursement number alone, and that changes how a practice should prioritize its work. A high-dollar biologic denial with strong overturn odds deserves physician time on a peer-to-peer call. A low-dollar denial with messy documentation is often better written off and traced back to its root cause instead of fought.
Denial triggers that are predictable before the claim is filed
Most elevated denial rates trace back to a short list of causes: prior authorization mismatches, drug-to-diagnosis inconsistencies, coverage eligibility lapses, and timely filing failures on secondary claims. None of this is random. Denials cluster by payer, by therapy type, and often by site of care. A practice's exposure has identifiable hot spots rather than an even spread across the whole claim volume.
Step therapy documentation gaps are among the most common causes of biologic prior authorization denials. Payers want proof the patient tried and failed conventional therapy first, and an incomplete record triggers a denial even when the clinical reasoning behind the decision is sound. The documentation standard isn't uniform either: each condition carries its own required history of prior therapies, and missing the specific elements a payer expects for that diagnosis gets the claim denied. Missing one piece of paperwork specific to the condition gets the claim denied.
Retrospective denials add a second failure point, arriving even after the prior authorization was approved. A payer can still deny the claim after the infusion happens, citing lack of medical necessity, if the chart doesn't match that payer's specific severity criteria. Biosimilar-first mandates add a third vector: plenty of payers now require biosimilar adalimumab or infliximab before they'll cover the reference product, so a patient stable for years on a reference biologic can get non-medically switched at renewal, triggering a new authorization requirement the practice never saw coming.
Bundling edits move fast, too. UHC updated its proprietary bundling edit library in the third quarter of 2025, adding 847 new code pairs to its unbundling detection list. Claims billed the exact same way that were clean the month before start denying, and nothing on the practice's end changed.
By the time any of this appears on an aging report, the decision that caused it happened days or weeks earlier: at intake, at benefit verification, at authorization, or when a treatment plan shifted without anyone updating the paperwork. Denial exposure is as much a scheduling and authorization problem as it is a billing one. A real exposure model has to trace root cause back to the workflow stage where the problem started, not stop at the claim stage where it finally became visible.
Payer-specific denial behavior that changes the exposure calculation by plan
The same claim, sent to two different payers, can fail for two completely different reasons. MBC's 2026 analysis across 240 specialty practices puts numbers on that: UHC generates significantly more modifier-related denials than BCBS, while BCBS generates a notably higher share of medical necessity denials. Structurally different failure modes call for structurally different appeals, and treating them as one problem is the mistake most practices make.
Part of the difficulty is that the rules keep moving under everyone's feet. UHC's ClaimCheck system and BCBS's AIM Specialty Health platform run different clinical edits, updated quarterly, usually without notifying providers. A practice's denial history for a given payer can go stale within a single quarter.
Deadlines vary by payer too, and missing one converts a winnable claim into a permanent loss for no clinical reason. UHC gives a short window from the denial date for peer-to-peer review. BCBS ranges from 30 to 60 days depending on the state. Applying UHC's clock to a BCBS denial by mistake turns a recoverable claim into a write-off over nothing more than a scheduling error.
Medicare Advantage plans deserve their own line item here. MA denial rates climbed 4.8% from 2023 to 2024, and injectable medications under MA plans face denial rates of 20 to 35%, well above what the same drugs see under traditional Medicare. UnitedHealthcare's MA Part B step therapy program imposes prior authorization requirements on certain medications, and practices need to proactively document patient utilizer status to protect continuity of care.
A model built at the aggregate level, total denials, average denial value, can't see any of this concentration. Grouping a BCBS medical necessity denial with a UHC modifier bundling denial hides the fact that they need different documentation, different appeal paths, and different clocks. Treating them the same is how MBC's data arrives at that 30 to 45% recovery gap.
Operationalizing the model: what practices need to track and when
The model only works if someone keeps it current, not rebuilt from an aging report every quarter. By the time a denial appears on AR, the drug capital is already locked up and the appeals clock has already started running.
Each layer needs its own tracking discipline. The reimbursement layer runs on standard AR aging by payer, claim, and denial reason code, and most practices already have this piece in place. The drug capital layer needs acquisition cost attached to each denied claim at the J-code level, so the dollars-at-risk figure sits right next to the reimbursement figure instead of buried in a separate inventory system. The appeals labor layer needs time logged per denial worked, broken out by staff role, because without that log the labor cost stays invisible even as it piles up week after week. The write-off layer needs a periodic audit of closed AR, specifically hunting for denied claims that aged past the appeal window with no appeal ever filed. Standard reporting misses this last layer entirely, because it was built to track what happened, not what never got attempted.
None of these four pieces replaces the others. A practice watching only AR aging is looking at the smallest number in the whole model. Adding drug capital, appeals labor, and the write-off audit together, the real exposure figure usually comes in several times higher than that first number suggested. It belongs in one connected system, tracked together, not scattered across four spreadsheets that nobody ever sits down and compares.