Biosimilar Reimbursement Rates vs Reference Biologic Spread
Medicare's reimbursement formula penalizes biosimilars priced below their reference drugs.

Medicare reimburses Part B drugs at average sales price plus an add-on percentage, and that formula was never built to handle two competing versions of the same biologic sitting at different price points. The ASP methodology took effect January 1, 2005, under the Medicare Modernization Act of 2003. The first U.S. biosimilar, Zarxio, did not reach the market until March 6, 2015. A decade of policy logic was locked in before the product category it now governs even existed.
The mechanics explain why the spread between a biosimilar and its reference biologic has nothing to do with which one works better or costs less to manufacture. The add-on is a percentage, but a percentage of what matters. A reference biologic with a high ASP generates a large dollar add-on even at a modest percentage, because 6% or 8% of a bigger number is still a bigger number. A biosimilar priced lower produces a smaller dollar add-on at the exact same percentage, simply because its base price is lower. Two drugs can treat the same condition, through the same mechanism, at the same dose, and still get reimbursed at different dollar levels purely because of where their ASP sits.
The Inflation Reduction Act tried to correct this imbalance without eliminating it. Starting October 1, 2022, qualifying biosimilars (those with an ASP not exceeding the reference product's ASP) get reimbursed at ASP plus 8% of the reference biologic's ASP, rather than the standard ASP plus 6% calculated on their own price. That provision runs for five years, raising the add-on for biosimilars that qualify, but it still ties the add-on calculation to the reference product's price instead of the biosimilar's own economics.
The spread a practice captures, the gap between acquisition cost and Medicare reimbursement, is not a signal of the biosimilar's clinical value or manufacturing efficiency but the output of a formula reacting to two separate prices that move independently of each other. A practice that treats spread as a stable, predictable number is treating a formula artifact as a fundamental fact. This billing complexity sits well beyond what generic revenue cycle platforms are built to track. A practice needs to see how each product's add-on is calculated against its reference biologic's price, not just the final reimbursement number that lands on a remittance. Infusion-focused platforms like Ruby RCM are built to isolate and forecast that product-level spread before a claim goes out, giving buy-and-bill practices the line-level visibility to know whether a biosimilar choice will capture margin or quietly introduce a loss.
ASP erosion under biosimilar competition and the shrinking dollar spread over time
The spread a practice sees in year one of a biosimilar's life is not the spread it will see in year three. ASP erodes as competition enters a class, and that erosion compounds faster than most stocking decisions account for. Markets where biosimilars launched in 2018 or later saw a 45% ASP drop by year three, compared to just 22% for those launched in 2016 to 2017. The pace of erosion is getting faster as more manufacturers enter these classes, not slower.
A second biosimilar entering a class within three years of the first can nearly double the downward pressure on ASP, accelerating the price decline for every product already competing in that space. The rebate cycle that drives this erosion compounds on itself. Biosimilar manufacturers offer rebates to win formulary placement. Those rebates lower the reported ASP. A lower reported ASP then drives Medicare's reimbursement rate down in subsequent quarters, because reimbursement is pegged to ASP with a lag. Manufacturers competing for formulary position are, as a direct side effect, compressing the margin available to every practice billing that product.
Acquisition cost does not always keep pace with that decline. When ASP-based reimbursement falls faster than the price a practice actually pays to acquire the drug, the practice ends up underwater: reimbursed for less than it spent to put the product in a patient's arm. The ASPE brief from January 2025 found that among eight reference biologics examined, five had biosimilar ASPs below the reference product, with payment limits for those biosimilars running considerably lower than the reference product's payment limit, a gap wide enough to reshape margin outcomes across those markets. Three of the eight had biosimilar ASPs that exceeded the reference product, reflecting reference manufacturers cutting their own prices to compete after biosimilar entry.
A product that looked like solid margin at launch can turn into compressed or negative margin within two or three years, without the practice's contract pricing ever changing. The race-to-the-bottom dynamic in these classes means a product's margin can vanish within two years of launch, flipping cash flow from positive to negative with no change in what the practice is contractually paying. Catching that shift before it becomes a permanent loss requires continuous, line-level reconciliation of acquisition cost against reimbursement, product by product. Revenue cycle systems that lack that granularity will miss the exact point where a biosimilar crosses from profitable to underwater, and the practice only finds out after several billing cycles have already eaten into margin.
What the reimbursement spread actually looks like across specific Medicare Part B biosimilar markets
The erosion pattern described above plays out differently depending on which molecule is involved, and the data on actual Medicare reimbursement makes that unevenness concrete. A retrospective analysis of Medicare reimbursement and ASP data for nine reference biologics and 30 biosimilars from 2018 to 2025 found that reimbursement for reference biologics generally rose before biosimilar entry, then declined in a variable and fairly modest way after entry. That is not the clean, uniform price compression story the formula might suggest on paper.
Pegfilgrastim broke from that pattern entirely, with its Medicare reimbursement dropping sharply. One molecule's reimbursement behavior gives no reliable guide to another's, even within the same regulatory structure.
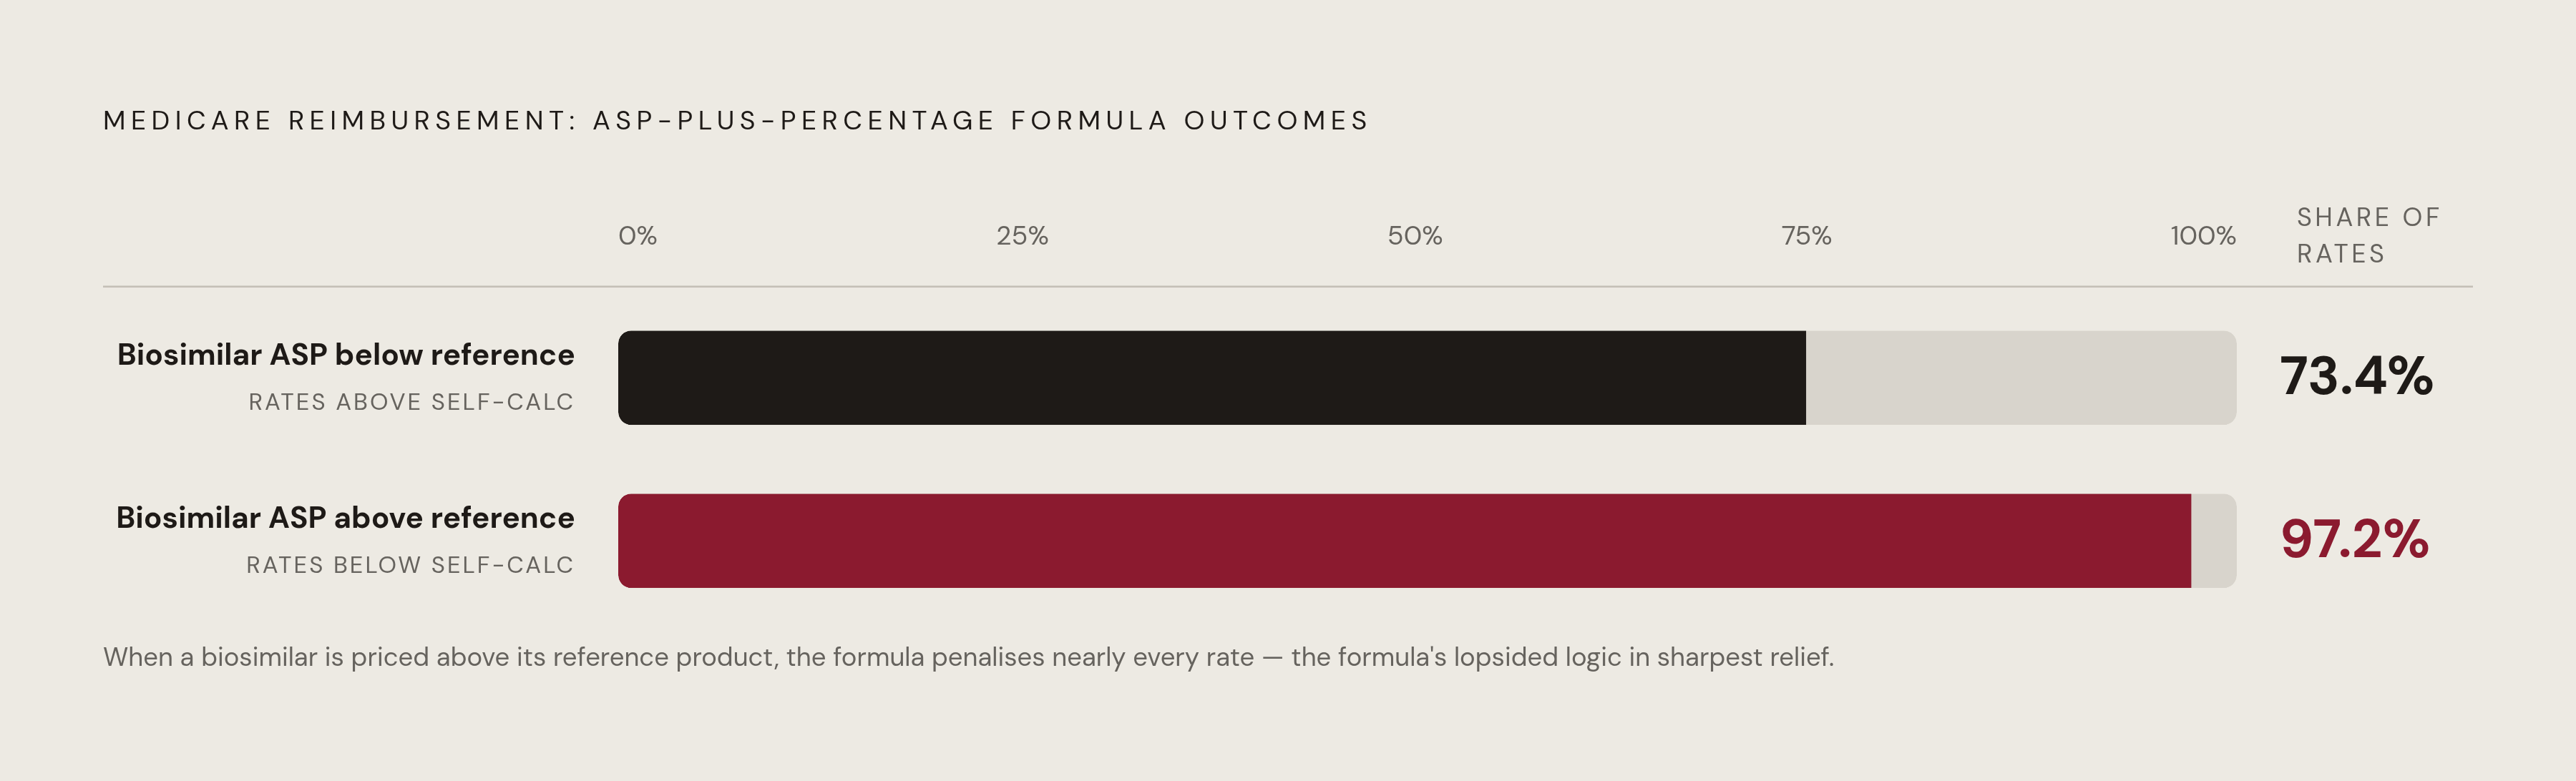
The formula's lopsided math is visible in the reimbursement rates themselves. From 2018 to 2025, when a biosimilar's ASP sat below the reference product's ASP, 73.4% of biosimilar Medicare reimbursement rates exceeded what a straight ASP-plus-6%-of-its-own-ASP calculation would have produced, because the add-on got calculated on the reference product's higher ASP instead. When a biosimilar's ASP exceeded the reference product's, 97.2% of biosimilar rates fell below what that same self-referential calculation would have produced. The formula rewards a biosimilar for being cheaper than its reference product and penalizes it for being more expensive, at a rate that swings hard in both directions.
Adoption numbers show the same lack of uniformity. The ASPE brief documents biosimilar uptake across the eight Part B classes it studied ranging from roughly a quarter of users on the low end to four-fifths on the high end. That spread is wide enough to make clear that reimbursement structure is one input among several driving adoption, not the sole determinant. Molecule-specific factors, prescriber habits, and manufacturer behavior all shape how a given class actually plays out.
Reference manufacturers are not passive in this. When they cut ASP to compete after biosimilar entry, the spread between the reference product and its biosimilars can narrow or even reverse, a dynamic the ASPE data captures in three of the eight biologics it examined. The spread a practice is working with today reflects a snapshot of manufacturer behavior that can shift again next quarter.
Commercial payers' own logic layered on top of Medicare's ASP framework
Medicare's formula at least publishes its logic. Commercial payers operate under no equivalent public rule, and the spread a practice captures on a commercial claim depends entirely on what a specific contract says, not on ASP mechanics anyone outside the negotiation can see.
The variation this produces can be extreme. Research on trastuzumab reimbursement in the Bay Area, using Q1 2024 price data from the three largest payers in that market, found median reimbursement for trastuzumab products ranging from roughly 149% of ASP for Herceptin, the reference biologic, up to 1,246% of ASP for Trazimera, one of its biosimilars. Biosimilars were nearly always reimbursed at lower rates than Herceptin on a relative basis, but the range across payers and products stretched wide, with Ontruzant under Anthem and Ogivri under Kaiser landing at substantially different rates from each other despite treating the same condition.
Commercial payers have largely not adopted a differential reimbursement approach that rewards biosimilar use the way Medicare's IRA provision attempts to. Pfizer-funded research published in JMCP points to this absence as the core reason commercial market incentives continue to favor reference biologic prescribing for most providers. Without a policy mechanism pushing commercial reimbursement toward biosimilars the way the IRA pushes Medicare, the default economics keep favoring the established product.
Rebate structures around reference biologics reinforce that default. Humira rebates have been reported to run 60% to 85% off brand WAC, Oliver Wyman found, with KFF Health News reporting rebates jumping this year by 40% to 60% of the drug's list price. Formulary economics built on rebates at that scale are not economics a commercial payer gives up easily, and biosimilars can end up reimbursed at rates that do not reflect the acquisition cost advantage they were supposed to offer.
For a practice billing across multiple commercial payers, this means the same product given to two different patients on the same day, by the same clinician, can produce two different margin outcomes depending solely on whose contract governs each claim. Payer-level spread tracking is the only way to know whether a stocking or substitution decision made sense before the remittances come back. Because that spread varies so much across therapeutic categories and payer contracts, decisions about what to stock and how to bill it need real-time, product-specific visibility. A revenue cycle platform built for infusion centers can track spread at the claim and product level instead of averaging it away into a number that hides which contracts are actually losing money.
That changes the calculus entirely for an eligible provider.
Why the spread a practice sees on a remittance is often not the spread it actually captured
Every mechanism covered so far describes the spread a practice should capture on paper. What actually lands in collected revenue depends on billing execution. A clean-looking remittance does not guarantee the practice got paid what its contract actually allows.
Payers routinely post underpayments as contractual adjustments, which makes those underpayments invisible without line-by-line, contract-level reconciliation. A practice glancing at a remittance and seeing no denial, no rejection, nothing flagged, can still be accepting a payment well below what its contract specifies. If the reconciliation window on that claim closes before anyone catches the discrepancy, the loss is permanent.
J-code accuracy determines how much of the theoretical spread actually survives into collected revenue. Each J-code corresponds to a specific drug and a specific unit count, and a unit-count error on a high-dose biologic infusion can produce an underpayment large enough to erase the spread advantage the biosimilar was chosen for. HCPCS Level II codes, J-codes included, update every quarter. A practice that does not update its billing systems with each quarterly release risks systematic underpayment on every claim using an affected code, or recoupment of overpayments it was never supposed to receive. The January 2026 HCPCS update alone added 160 new codes and deleted 101. Staying current with that volume of change, every quarter, is a recurring operational cost that the ASP formula does not account for.
Any spread calculation a practice runs when choosing between a biosimilar and its reference product has to account for billing execution quality as a real variable, not an afterthought. A practice with weak J-code accuracy or no contract-level reconciliation process can lose more to billing execution failures than it would ever gain from chasing the better spread on a complex, high-dose biologic. In that situation, a simpler product mix the practice can bill cleanly may outperform a theoretically higher-margin product it cannot execute on. The spread on paper and the spread in the bank account are two different numbers, and only one of them pays the staff.
Sources
- January 2025 ISSUE BRIEF 1 HP-2025-03
- Greater uptake, an alternative reimbursement methodology needed to realize cost-saving potential of oncology biosimilars in the United States - PMC
- The impacts of Medicare biosimilar reimbursement policies.
- ISPOR - Variation in Provider Reimbursement for Biosimilars and Reference Biologics by Commercial Payers