Freestanding Infusion Center Chair Economics and Revenue per Visit
Profitability depends on drug margin, billing accuracy, and payer management—not just filling seats.

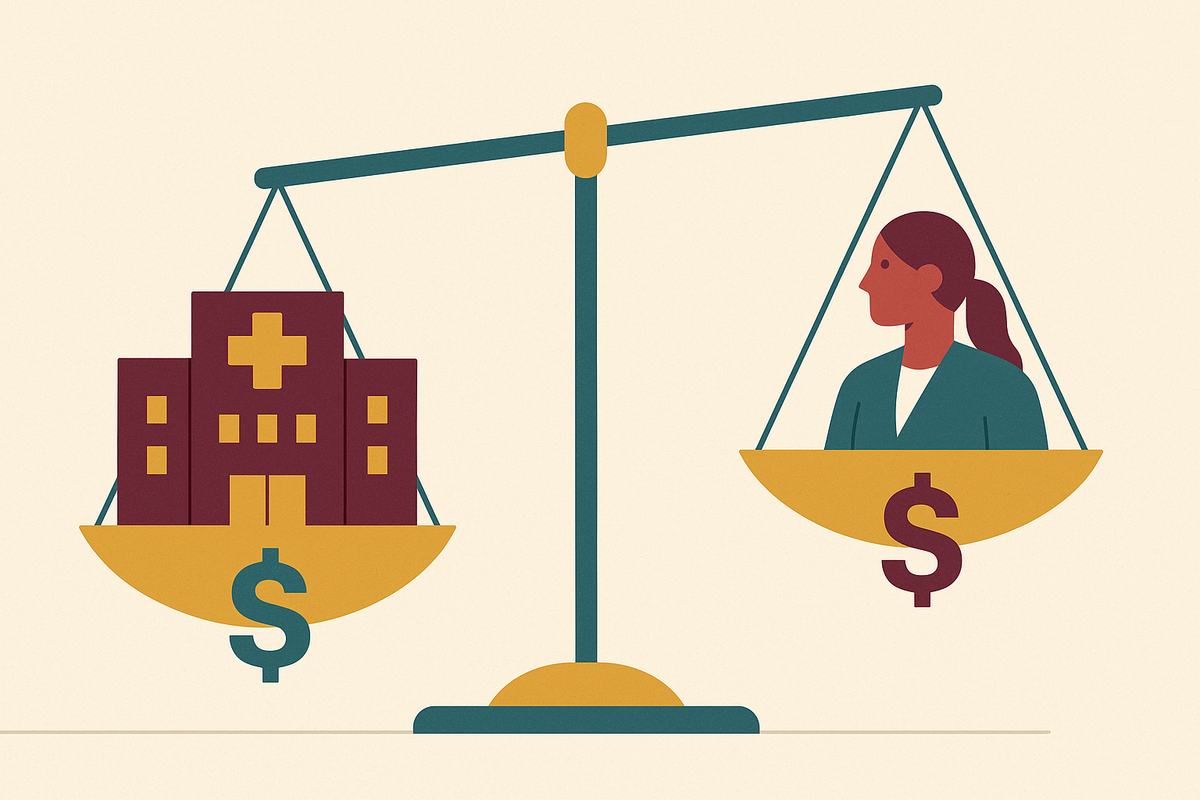
An infusion center’s revenue per visit depends on more than filling its chairs. Each occupied chair creates earning potential, but drug margin, administration billing, payer mix, and collection determine how much becomes income. Chair economics is the framework that connects those decisions. Its central lesson is blunt. More visits cannot make up for an operating model that keeps losing money between treatment and payment.
Why the infusion chair is the right unit of analysis for center economics
The chair is the right unit of account because treatment is where the center’s billable activity comes together. Drug margin, administration fees, and ancillary capture all depend on a patient receiving care. Total revenue for the center hides how visits differ, while looking only at each drug leaves out the time and administration work it takes to give treatment. The chair connects those economics to the capacity required to produce them.
Krishnan’s 2026 ASCO framework identifies UnitedHealthcare and Aetna as having implemented site-of-care restrictions that channel nonurgent infusions toward freestanding ambulatory centers. It describes the shift as “an executing reality,” not a projection. Yet Krishnan also identifies a gap in how health systems assess the opportunity. A comparison of hospital outpatient contribution margin per chair with the capital cost of a freestanding build leaves out drug margin, payer mix, authorization integrity, and how well billing is done. Those variables determine what each chair earns, and their effects compound across the center.
The two revenue streams every occupied chair generates through drug margin and administration fees
A completed infusion visit has two distinct economic components. Drug margin is the spread between the drug’s acquisition cost and payer reimbursement. The administration fee pays for delivering the infusion and is tied to CPT codes. Combining them into one revenue figure obscures whether a visit earns money through the drug purchase, the administration service, or both.
Drug identity therefore matters as much as visit count. Relevant drug billing codes include J1745 for infliximab (Remicade, reference product), Q5115 for a rituximab biosimilar, J3262 for tocilizumab, J0129 for abatacept, and J1602 for golimumab. Drug margins range from single-digit to high-teen percentages of drug cost, depending on the product. At moderate annual infusion volumes, that spread can account for a substantial share of center income.
The administration stream is smaller and more predictable, but it has its own billing rules. CPT 96413 covers the first infusion hour, and add-on code 96415 covers each hour after that, with work RVUs from both kept separate from drug billing. Sequential and concurrent drug codes, including 96417 and 96368, carry different reimbursement values when multiple drugs are administered during an encounter. When a biosimilar conversion raises drug margin, the administration fee stays the same, while more visits bring in more from both streams. A denied claim, by contrast, can stop payment on both.
How chair utilization translates volume into center-level financial performance
Lease costs, nursing staff, and pharmacy infrastructure do not fall at the same rate as the number of chairs in use. As a result, a small change in daily throughput can have a large effect on revenue available to cover those costs. Strong revenue per visit is not enough if too few visits occur, just as a full schedule is not enough if each visit earns too little.
The number of visits a chair can support depends on scheduling density, referral conversion, infusion duration, and therapy mix. A multi-hour biologic infusion occupies a chair for a full session but creates more 96415 add-on billing. Shorter infusions let a chair serve more visits each day but bring in less administration revenue per visit. Payer mix also matters because the same number of visits can bring in different net revenue under Medicaid and commercial insurance.
Operational execution can also limit utilization even when demand exists. Authorization failures, missed scheduling opportunities, and last-minute insurance-related cancellations leave capacity unused. An occupied chair still falls short of its revenue potential when the visit is billed incompletely or incorrectly.
Where drug margin erodes through J-code precision, unit calculation, and encounter sequencing
CompleteRx’s work with a freestanding Texas infusion center shows how a billing setup can quietly undermine drug economics. A review of margin for each drug found discrepancies in IVIG billing codes that had gone unseen until then. Correcting and rebilling those discrepancies materially improved profitability. Discrepancies embedded in the bill code setup could recur across visits.
Most outpatient drug claims need NDC reporting, and the number of units billed must equal the dose given divided by the J-code unit size. Dose adjustments, split vials, and rounding at the point of care create opportunities for that calculation to go wrong. A unit-count error on a high-dose infliximab infusion can reduce payment meaningfully on one claim. When the error repeats across the week’s visits, a small mistake in the math can add up to a large loss over the year.
The initial-substance infusion CPT code applies only to the first drug, while a second drug requires the appropriate sequential or concurrent code. Incorrect sequencing can trigger NCCI edits, forcing rework and resubmission that add accounts receivable days. Drug acquisition program modifiers and waste modifiers add further compliance requirements. These are systematic risks because a flawed setup or repeated coding choice can distort otherwise correctly delivered care.
Prior authorization as the upstream gate on every dollar a chair can generate
Coding mistakes may be corrected after treatment, but some authorization failures cannot. A completed infusion must have prior authorization to be payable. For recurring biologic therapy, an approval may cover a defined number of sessions or a specific treatment window. Once that approval expires, further treatment can become unrecoverable revenue if the payer does not allow retroactive authorization.
Authorization management therefore has to begin before the treatment cycle and account for renewal before the current approval ends. An original approval is not protection for an indefinite course of care. Payers can also change requirements during the year, sometimes without notifying providers, so a drug or code that needed no authorization in one quarter may need it in the next. If treatment pauses while renewal is pending, the financial effect moves upstream from unpaid claims to empty chairs.
The NAIC’s 2024/2025 survey found that a majority of health insurers were using or exploring AI for prior authorization approval processes, although only 37% across all markets reported current use for prior authorization. Short appeal windows leave little room for weekly or biweekly denial reviews. The operational priority is to prevent authorization failures before treatment, because a later appeal cannot always repair them. Failures that escape that control then enter the denial workload.
Denial patterns by payer and what they reveal about root cause
Infusion denials are not uniform events with a single remedy. Medicare denials, for example, often stem from missing or flawed medical necessity documentation. A rise in denials elsewhere may reflect an authorization workflow problem or a formulary policy change. Treating all of those outcomes as generic billing failures hides the distinction needed to understand them.
Broad labels such as administrative or clinical can conceal that signal. Tracking denials by payer and root cause separates a documentation gap from a policy change and shows whether the problem is concentrated or widespread. That makes pattern recognition a management capability. The same analysis informs both recovery work and changes to the process that produced the denial.
Concentration also changes where appeals effort belongs. A top-denying payer that accounts for a disproportionate share of aged receivables warrants a dedicated appeals specialist handling its claims separately from the general queue. Shortened appeal windows make that distinction more urgent. Routing a claim to the wrong recovery path can consume the time available to challenge it. Without payer-level analysis, a center can work hard on denials while remaining blind to why they recur.
Underpayments hidden in remittances and the revenue the center never knows it lost
A denial announces a payment problem, but an underpayment can look like a successful collection. The payer pays the claim while posting the shortfall as a contractual adjustment. Unless someone compares the remittance with the contract, the payment may appear correct. That is why underpayment needs a different control from denial management. A claim marked paid is not necessarily a claim paid in full.
The decisive comparison is expected reimbursement against actual reimbursement at the claim-line level. A payer performance scorecard makes those differences visible by payer rather than measuring performance only by cash received. High-cost biologic claims make the distinction especially important. A shortfall that looks like ordinary variance in aggregate revenue can represent a material loss on one visit.
The opportunity to dispute that shortfall is also limited. Underpayment dispute windows typically range from 60 days to 2 years, depending on the payer and state. After the applicable window closes, the payment is final even if it was incorrect. Without line-level reconciliation, the center may have to write off those shortfalls for good. If they remain as unresolved balances instead, they join aged accounts receivable, where recovering them becomes the next problem.
AR aging in infusion and why high-dollar claims deteriorate faster than average receivables
Aged accounts receivable, or AR, is where earlier revenue failures accumulate. Denied claims, underpaid claims, and claims submitted with errors all reach this stage when they are not resolved promptly. In infusion, each drug claim can be so large that even a small share of aged claims puts a lot of money at risk. At meaningful monthly billing volume, a 90+ day bucket can put tens of thousands of dollars at collection risk. The money at collection risk is tied to care already delivered.
Payer segmentation provides a basis for prioritizing that risk. A payer responsible for a disproportionate share of aged denials warrants a dedicated appeals track. Slow-paying commercial plans require an increase from monthly attention to weekly status follow-up. A single queue treats a high-dollar biologic denial like a low-dollar administration claim despite their different financial stakes. That approach can let the largest balances pass through their recovery windows.
Acquisition cost set the starting drug spread, coding set the administration charges, and authorization decided whether the payer would pay for treatment. Billing errors and underpayments reduced collections, while aging now limits what remains recoverable. The center has to look at those stages together because each affects the same balance. They are connected symptoms of how the revenue operation is structured.
How the operating model determines which revenue problems become permanent
The operating model determines where revenue work begins, who owns it, and whether it matches infusion care. If that work starts at claim submission, authorization gaps, formulary problems, and incomplete documentation may already be embedded in the patient record. Centers that perform well make authorization part of the clinical scheduling workflow. That places control before the service is delivered, when the center still has a chance to prevent a loss that would otherwise require recovery work.
Recurring biologic authorizations, J-code unit calculations, multi-drug sequencing, and 340B modifier compliance require more than a general-purpose billing workflow applied to infusion volume. Automation does not remove that need for judgment. Rules that miss how each payer works or how policies change mid-year can make the same errors happen faster and leave them unfixed. The staffing decision is therefore whether those capabilities exist in-house, come through a specialized partner, or are absent.
Utilization sets the revenue ceiling, billing execution determines how much is charged correctly, and authorization governs whether those charges are payable. Underpayment detection reveals incomplete payment, while AR management governs recovery of any remaining shortfall. Each layer multiplies the effect of the one before it. The center’s real economic unit is the chair, but its ability to keep what that chair earns depends on the operating model around it.